Portland's Climate Resilience Mapping
Neighborhoods Designing for the Next Emergency
Illustrative only. Character Developer has not published measured client results. Names, quotes, and figures here are scenarios, not outcomes we have delivered.
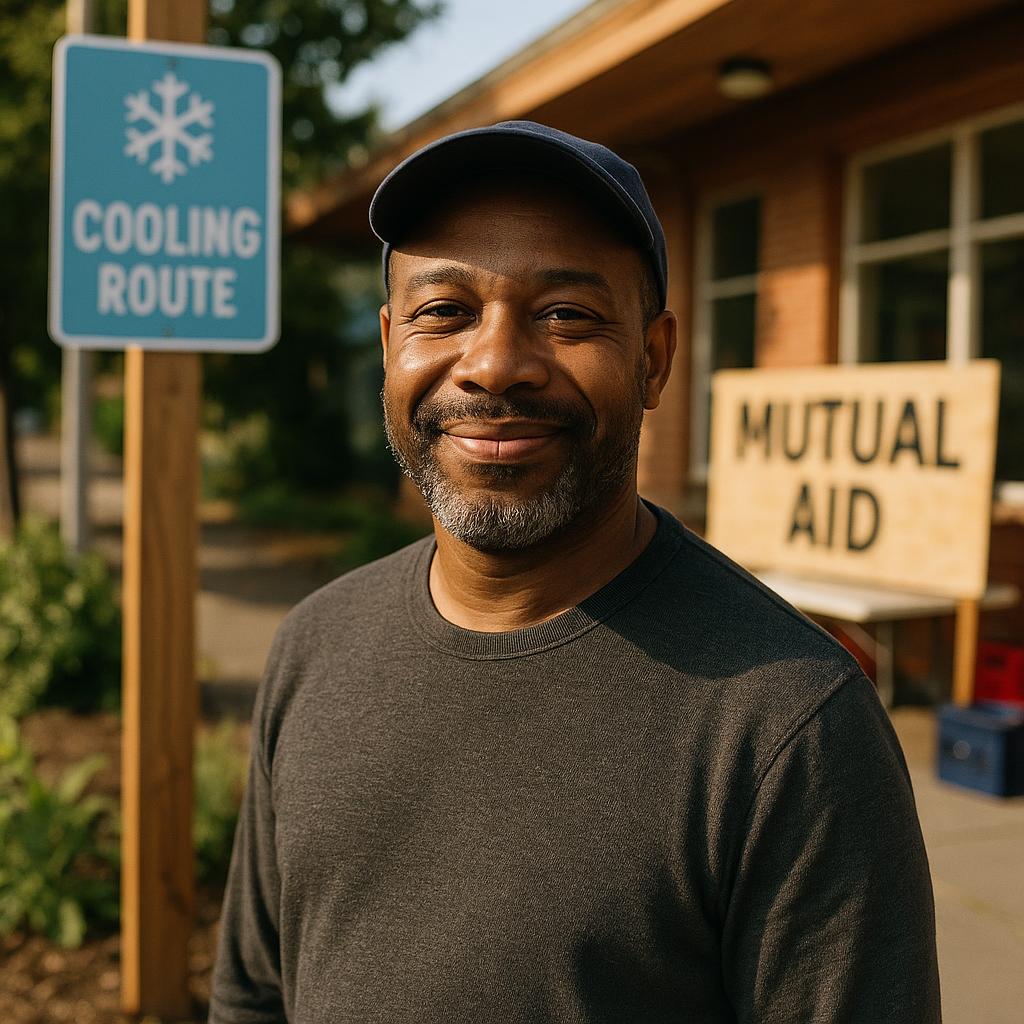
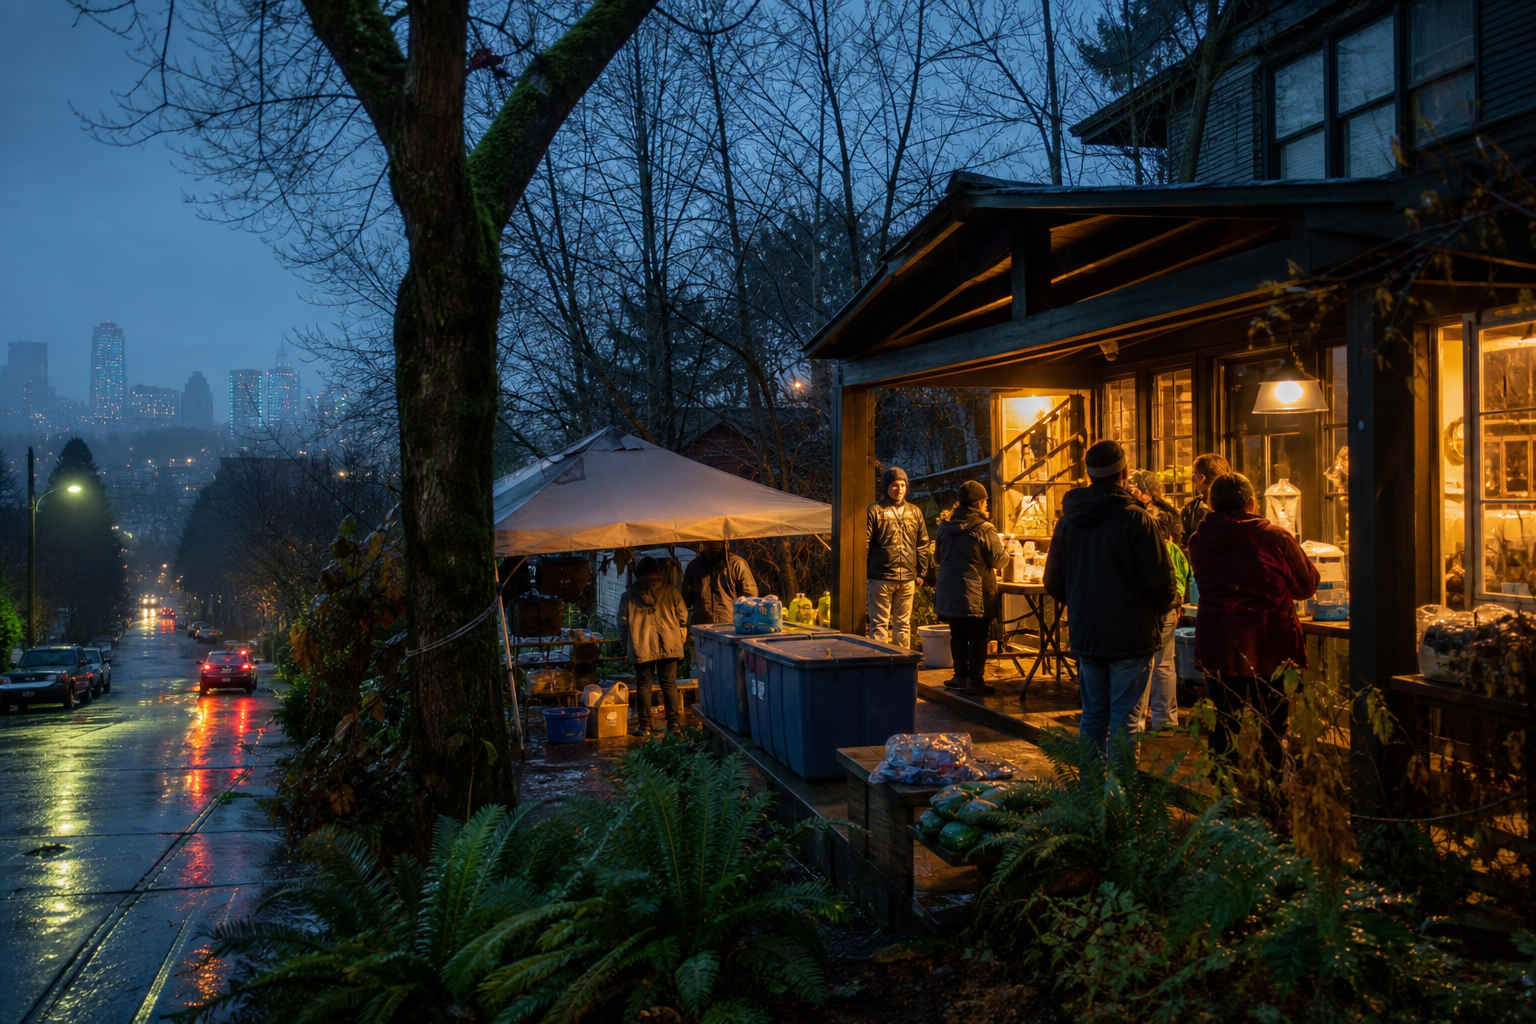
Neighborhoods mapped climate vulnerabilities and designed community resilience hubs using AR visualization, so heat, flood, and wildfire risks became legible block by block.
“We stopped waiting for a citywide plan to feel real. Mapping our own streets made preparedness something neighbors could own together.”
NOT A MEASURED RESULT
This narrative is a teaching sketch. It does not report participation, satisfaction, investment, or return from a Character Developer project.
THE CHALLENGE
Citywide climate plans did not translate into actionable neighborhood knowledge. Residents knew heat waves were worse, but could not see cooling corridors, flood pockets, or hub locations in their own streets.
THE APPROACH
Block captains collected lived experience of heat and flooding. The platform layered that with municipal hazard data. Neighbors then co-designed resilience hubs, cooling routes, and mutual-aid staging areas.
START WITH A NAMED PLACE
A pilot begins with a decision owner and a place. Results are published only after that work is measured.